Golf / Odessa Country Club / March 2026
Odessa Country Club: Greens Performance Analysis
Per-green slope, contour, and pin-placement analytics across the putting surfaces.
The question
The club wanted to know which pin positions still held at the green speeds they were running, and which surfaces had crept past the point where a ball will sit still. A stimpmeter and a level can only tell you so much across eighteen greens.
What we flew
We flew every putting surface in-house with drone LiDAR and photogrammetry, then built each into a high-fidelity model of the green and its collar. Fine enough to read the breaks a stimpmeter feels but can’t map.
What the model shows
Slope and contour across every surface, the pinnable ground separated from what runs too steep to cup, and the low lines water follows off the green. Read it one green at a time, or stack all eighteen and compare.
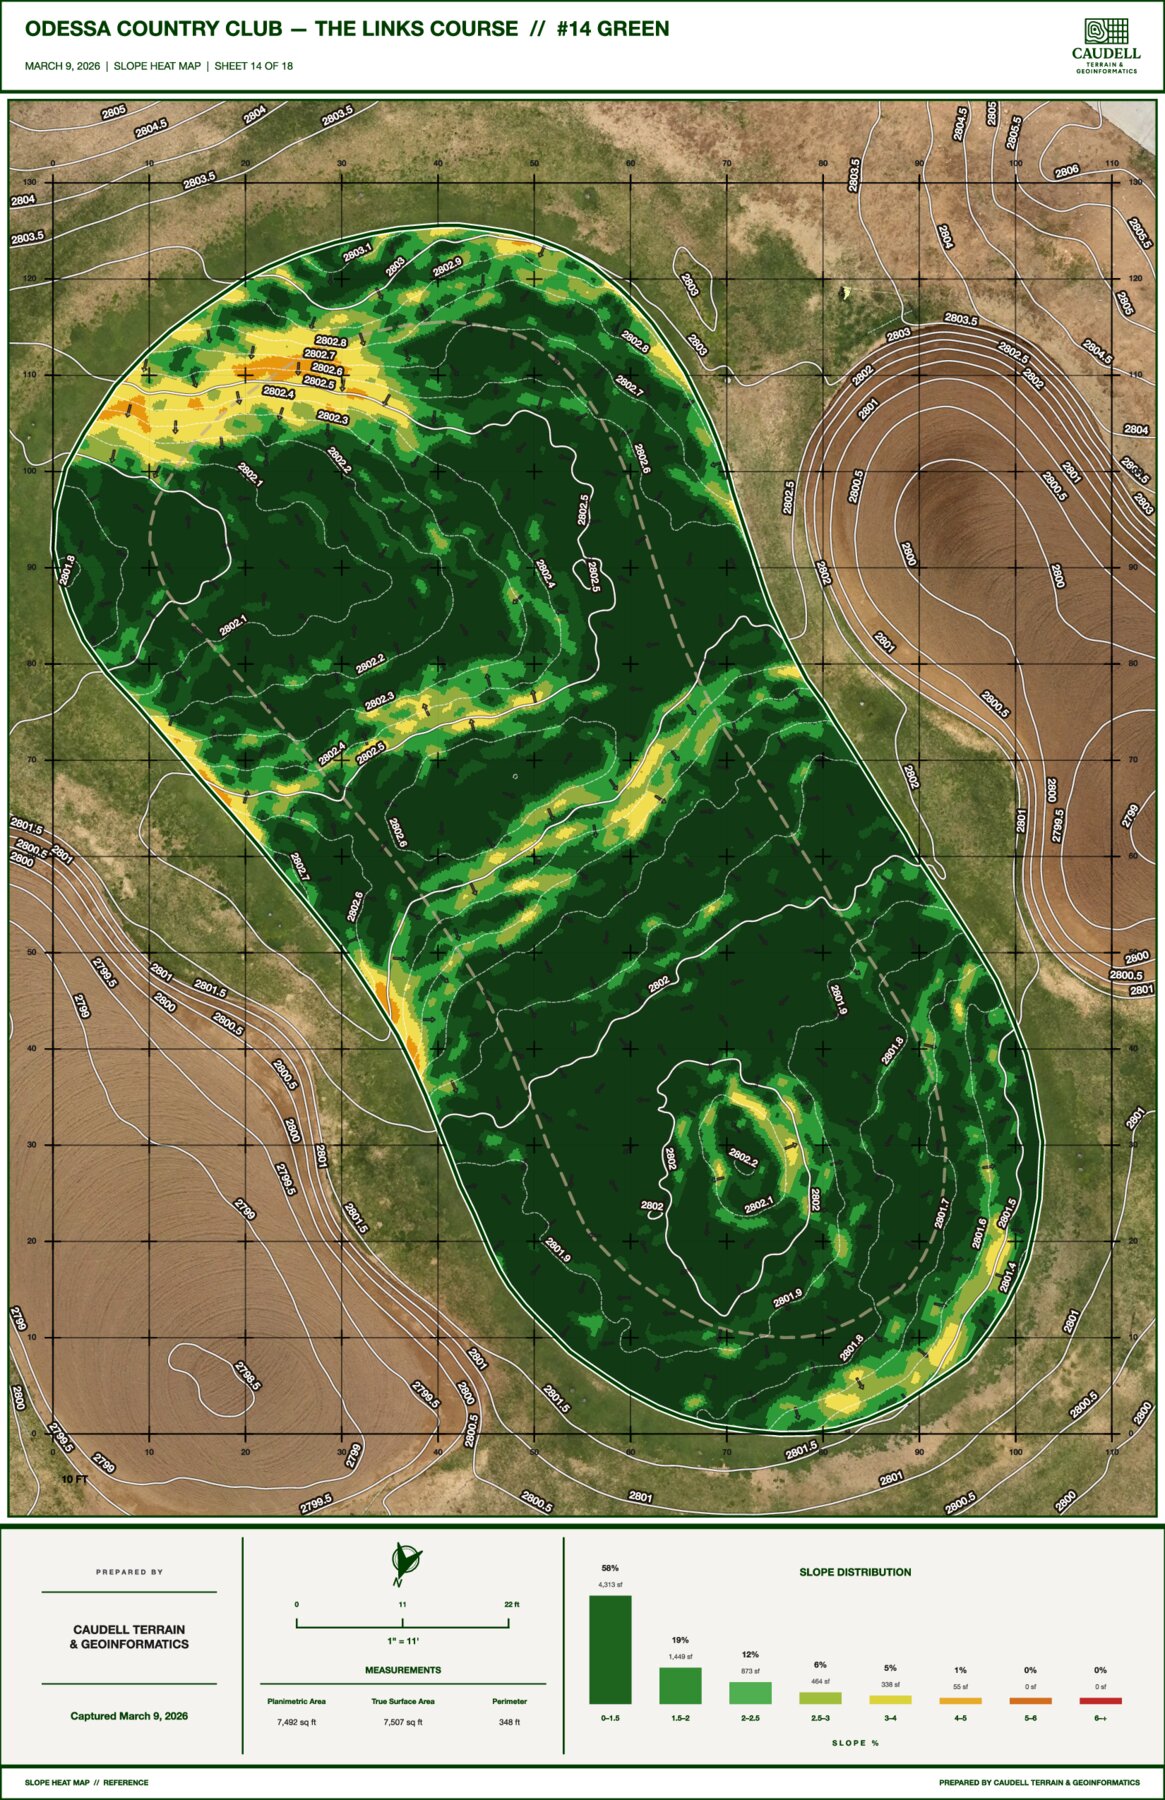
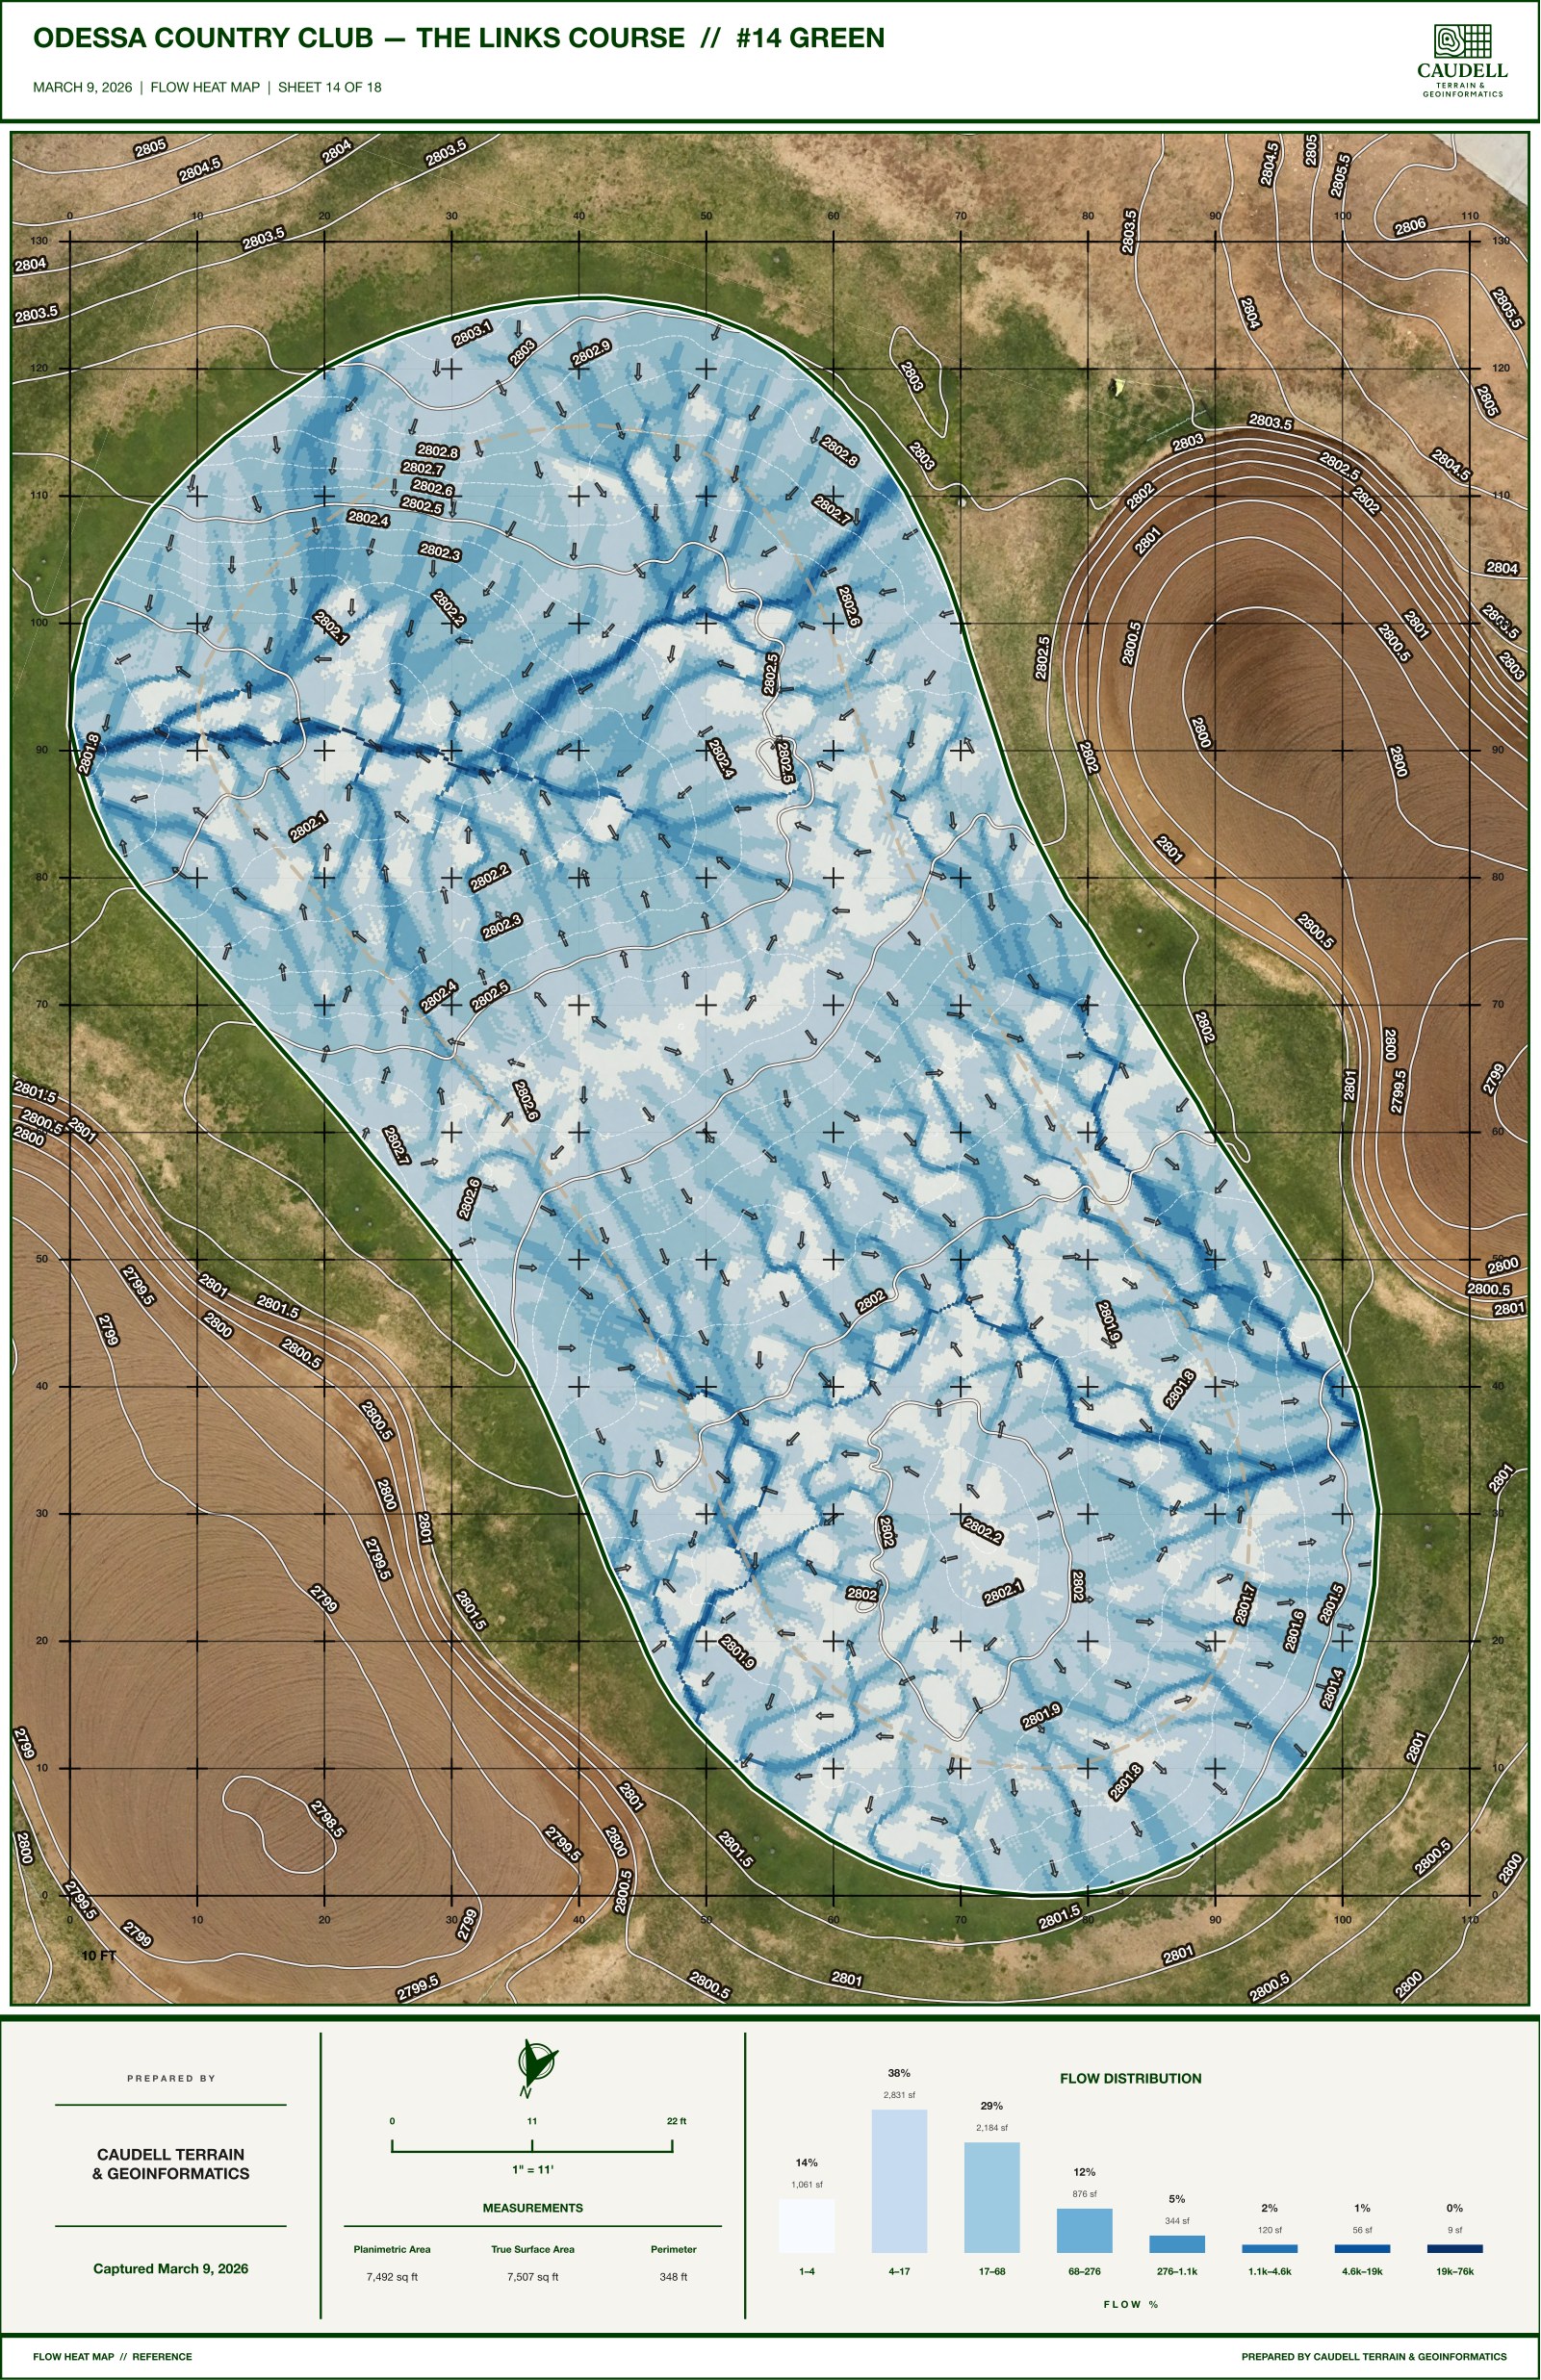
The deliverable
A per-green analytics set: slope-shaded surface maps, pin-placement zones, and drainage paths. Built for the agronomy plan and for tournament-week setup.
Get in touch: jacob@caudelltg.com